HYMC I 21.66
NASDAQ: HYMC I 21.66
|
CHANGE: 1.77
|
VOL: 2,012,745

HYMC I 21.66
NASDAQ: HYMC I 21.66
|
CHANGE: 1.77
|
VOL: 2,012,745
home > Hycroft mine
Stage
Development
Develop-ment
Resources
Gold / Silver
Ownership
100%
Acres
64,000
M&I Gold Oz
16.4
M
Inferred gold
5.03
M
M&I Silver Oz
562.6
M
Inferred silver
132.8
M
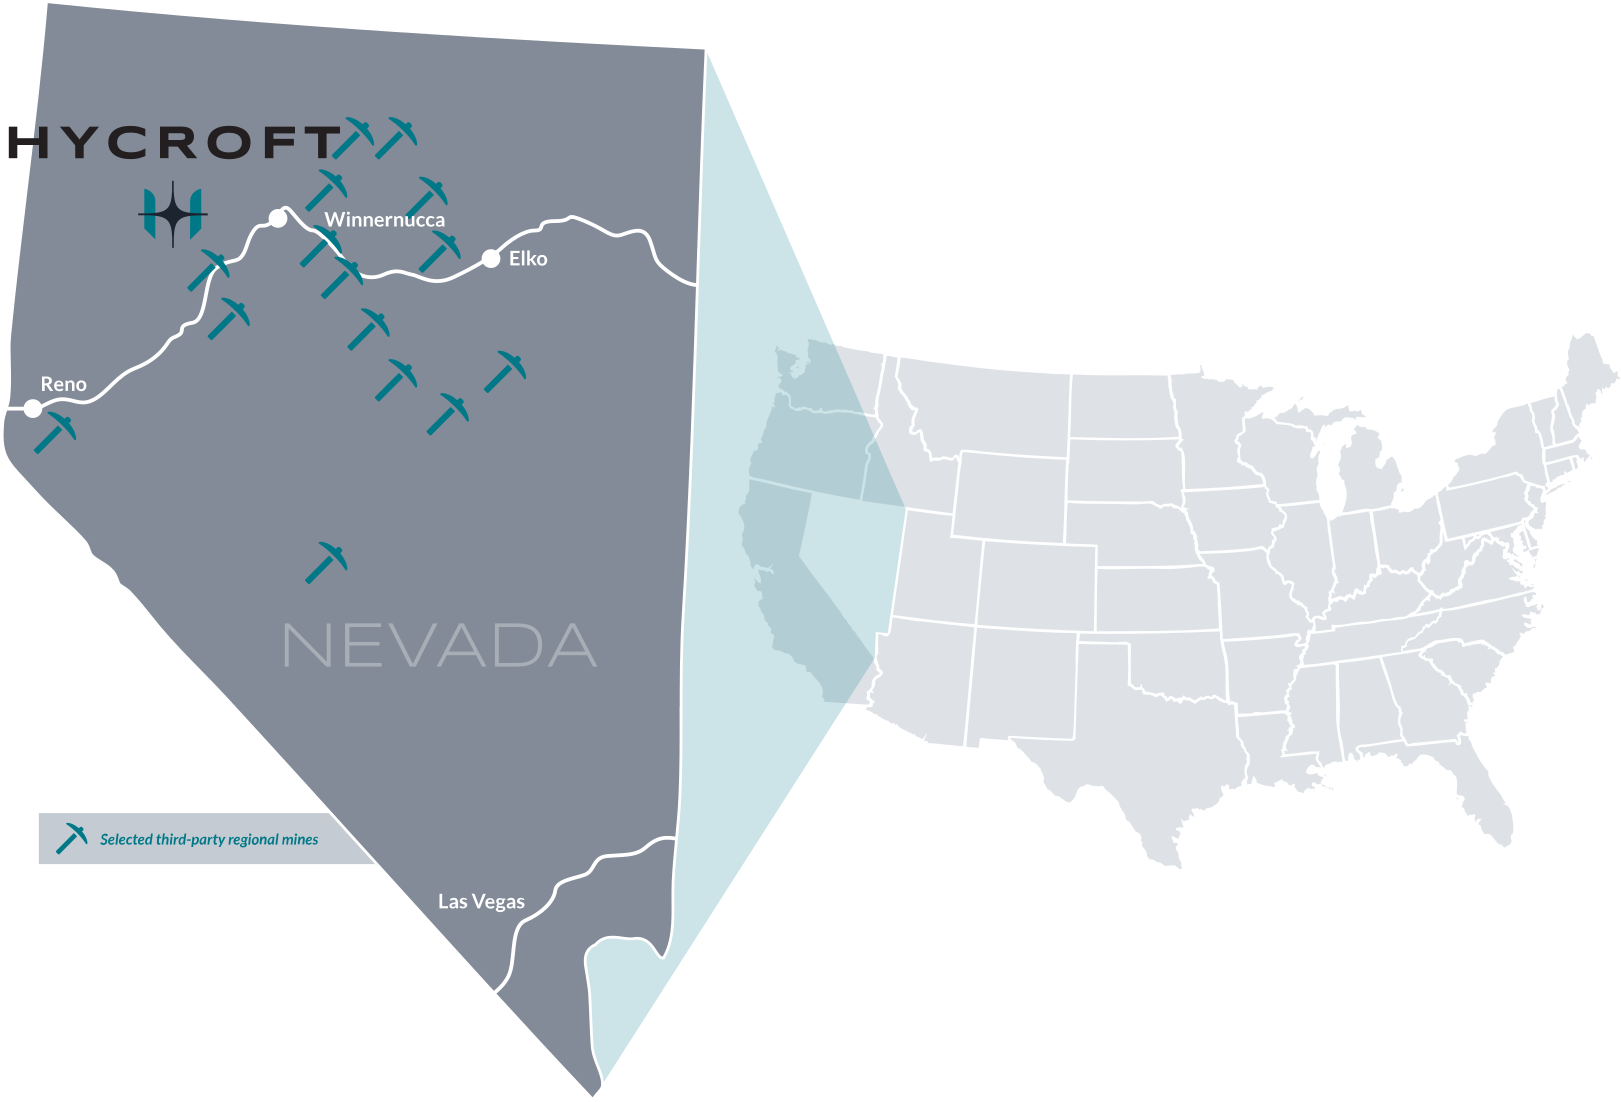
The Hycroft Mine is located in the Sulfur Mining District, 54 miles west of Winnemucca, and straddles Humboldt and Pershing counties, in Nevada.
The mine is accessible year-round via Nevada State Route 49 (Jungo Road) and the Union Pacific railway. It encompasses approximately 64,000 acres, including both patented and unpatented claims.
Gold and silver are shown separately and on their own scales, because expressing them as a single equivalent figure hides the contribution of each. The mineralization remains open in all directions and at depth, and inferred resources are not included in the mine plan set out in the Technical Report Summary.
Contained ounces from the January 2026 Mineral Resource Estimate, combined heap leach and mill, based on metal prices of $3,100 per ounce gold and $36.00 per ounce silver. Mineral resources are not mineral reserves and do not have demonstrated economic viability. Numbers may not sum exactly due to rounding.
The S-K 1300 Technical Report Summary and Initial Assessment (the “TRS”), published in June 2026, confirmed the scale, quality, and long-term potential of the Hycroft Mine.
The project delivers strong economics and significant leverage to rising gold and silver prices, reinforcing Hycroft’s position as one of the sector’s most compelling large-scale development opportunities, located in a tier-1 jurisdiction.
NPV5 - Base case, pre-TAX
$5.4
B
NPV5 - Base case, post-TAX
4.3
B
NPV5 at spot prices
$10.0
B
IRR — PRE-TAX / POST-TAX
18.9
% /
16.9
%
IRR AT SPOT, POST-TAX1
30.1
%
GROSS REVENUES — BASE CASE
54.2
B
MINE LIFE
51
years
AVERAGE ANNUAL PRODUCTION
204,000
oz gold
6.8
M oz silver
295,000
oz AuEq
LOM CASH COST2 / AISC3
$1,924
per oz AuEq
$2,147
per oz AuEq
1 Spot prices for gold and silver as of May 25, 2026: $4,569 per ounce of gold and $77.94 per ounce of silver
2 Cash costs consist of mining costs, processing costs, mine-level G&A, and refining charges and royalties
3 All-in sustaining costs includes cash costs plus sustaining capital and closure costs
Hycroft Project S-K 1300 Technical Report Summary IA with Economics (2026)
Initial Assessment with economics for the POX and heap leach mine plan.
Hycroft Technical Report Summary with Updated MRE (2026)
Updated mineral resource estimate for the Hycroft Mine.
Hycroft Mine Technical Report (2023)
Prior technical report, retained for reference.
Buy from a range of high quality shirts, jackets, hats, and other items, only available for sale in our online.